Everything has been statistics related in both 6th and 8th grade math over the past few weeks! Of course, we better start with some corny statistics humor first (answer at the bottom of this post). I thought of this one myself, so I will apologize for the terrible joke now. On a side note, I recently began sending out a weekly newsletter every Sunday morning. Each newsletter includes classroom tips, a freebie, and math humor. If you are interested, you can sign up at the link below! Please share with any other teachers you know that might be interested!
Alright, onto the good stuff! Here are a few easy prep, yet effective, ideas to help teach statistics in the middle school math classroom.
1. Data Displays Foldable Notes
This is one of those ideas that came to me in the middle of the night on one of those nights you just can't sleep because your mind is going a million different directions (if you're a teacher, you've surely been there before...). I have used foldable notes before with other concepts. For whatever reason, my students are way more likely to copy down notes if you fold them first. Weird, I know. We had been learning about various data displays. In 6th grade, we had covered finding the measures of central tendency, box-and-whisker plots, frequency tables, and stem-and-leaf plots. We also later added histograms to this foldable. In the activity, students each got two dice. They rolled the dice and multiplied the two numbers to get each number in their data set. I set a minimum of twelve rolls, so that they would have at least twelve pieces of data. After getting their set of numbers, they had to find or create each the measures/displays pictured. This was a fun, hands-on way to review and I also allowed students to use these notes on their mid-chapter quiz.
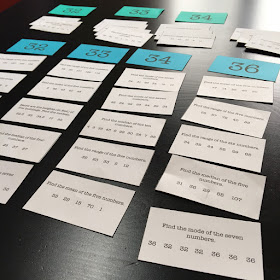
2. Mean, Median, Mode, and Range Math Sort
These sorts are one of the more engaging resources that I have created. I usually use these as a math workshop center, but I have also had students work on them individually or in small groups. For each set, students must sort the cards under the correct answer. Eventually, each of the four answer cards should have five problem cards sorted underneath. Once sorted, the students flip over the cards and must unscramble the funny phrases on the back! You can click HERE to get a copy of this resource. This particular sort focuses on finding the mean, median, mode, and range... other topics are also available in my TpT store!
3. Class Survey Circle Graph
When it comes time to learn about statistics, we do a lot of class surveys. This year we did number of pets, states traveled to, number of siblings, and in the example pictured we voted for a celebrity president. As you can see, we had some interesting candidates. We used the results from our class election to create a circle graph. It was a great way to get students engaged in our lesson!
I hope you all have found some useful ideas for teaching statistics and have a great rest of the school year!
Answer to the Math Joke of the Week: Histo-gram :)


